
This article appeared in a journal published by Elsevier. The attached
copy is furnished to the author for internal non-commercial research
and education use, including for instruction at the authors institution
and sharing with colleagues.
Other uses, including reproduction and distribution, or selling or
licensing copies, or posting to personal, institutional or third party
websites are prohibited.
In most cases authors are permitted to post their version of the
article (e.g. in Word or Tex form) to their personal website or
institutional repository. Authors requiring further information
regarding Elsevier's archiving and manuscript policies are
encouraged to visit:
http://www.elsevier.com/copyright

Author's personal copy
ARTICLE IN PRESS
Deep-Sea Research I 55 (2008) 1035Ł 1047
Contents lists available at ScienceDirect
Deep-Sea Research I
journal homepage: www.elsevier.com/locate/dsri
Enhanced seamount location database for the western and central
Pacific Ocean: Screening and cross-checking of 20 existing datasets
Vale┤rie Allain a,├, Julie-Anne Kerandel a, Serge Andre┤foue©t b, Franck Magron a,
Malcolm Clark c, David S. Kirby a, Frank E. Muller-Karger d,1
a SPC, BP D5, 98848 Noume┤a Ce┤dex, New Caledonia
b IRD, BP A5, 98848 Noume┤a Ce┤dex, New Caledonia
c NIWA, Private Bag 14-901, Kilbirnie, Wellington, New Zealand
d Institute for Marine Remote Sensing, University of South Florida, USA
a r t i c l e
i n f o
a b s t r a c t
Article history:
Seamounts are habitats of considerable interest in terms of conservation and biodiversity,
Received 5 September 2007
and in terms of fisheries for bentho-pelagic and pelagic species. Twenty previously
Received in revised form
compiled datasets including seamount/underwater feature lists, bathymetric maps and
14 April 2008
emerged feature maps from different sources (ship-derived and satellite altimetry-
Accepted 17 April 2008
derived) at different spatial scales (from individual cruise to worldwide satellite data)
Available online 4 May 2008
were gathered in order to compile an enhanced list of underwater features for parts of the
Keywords:
western and central Pacific Ocean (WCPO). The KL04 dataset [Kitchingman, A., and Lai, S.,
Seamounts
2004. Inferences on potential seamount locations from mid-resolution bathymetric data.
Satellite altimetry
Fisheries Centre Research Reports 12 (5), 7Ł12], listing seamount positions and depths as
Seafloor mapping
Tuna fisheries
calculated from satellite altimetry-derived bathymetry, provided the baseline data for this
Marine-protected area
study as it covered the entire region of interest and included summit depth information.
High seas
All KL04 potential seamounts were cross-checked with other datasets to remove any
Western and central Pacific Ocean
atolls and islands that had been incorrectly classified as seamounts, to add seamounts
Landsat
undetected by KL04, to update the overall database (geolocation, depth, elevation, and
name) and to compile a 12-class typology of the different types of underwater features. Of
the 4626 potential seamounts identified in KL04, 719 were multiple identifications of the
same large underwater features and 373 (10%) were actually emerged banks, atolls and
islands, leaving 3534 actual underwater features. Conversely, 487 underwater features
were documented in other datasets but not registered by KL04. The screening of all the
potential WCPO seamounts produced a final list of 4021 underwater features with agreed
upon position and information. This enhanced list should have many applications in
oceanography, biodiversity conservation and studies of the influence of seamounts on
pelagic ecosystems and fisheries.
& 2008 Elsevier Ltd. All rights reserved.
1. Introduction
Submarine mountains, or `seamounts' are major geo-
morphological features of the ocean floor. They are of
considerable geological, oceanographic and biological
├ Corresponding author. Tel.: +687 262000; fax: +687 263818.
interest. Geologically, the abundance and distribution of
E-mail address: valeriea@spc.int (V. Allain).
1
seamounts provide information on seafloor formation
New address: Dean, School for Marine Science and Technology,
(Batiza, 1982; Smith and Jordan, 1988; Hillier and Watts,
University of Massachusetts, Dartmouth New Bedford, 02744-1221, MA,
USA.
2007). From the oceanographic point of view, seamounts
0967-0637/$ - see front matter & 2008 Elsevier Ltd. All rights reserved.
doi:10.1016/j.dsr.2008.04.004
Author's personal copy
ARTICLE IN PRESS
1036
V. Allain et al. / Deep-Sea Research I 55 (2008) 1035Ł1047
have an impact on circulation of the water masses (White
Various communities of users have access to numerous
et al., 2007) and their correct position is also necessary to
online databases providing seamount information, bathy-
properly forecast tsunami propagation (e.g., Mofjeld et al.,
metric maps, surface feature maps and so on. For people
2001). Biologically, they are considered as biodiversity
willing to use these publicly available datasets, it is puzzling
hotspots with high levels of endemism (Richer de Forges
to realize, with a simple, geocorrected, overlay of the
et al., 2000; Worm et al., 2003). They also aggregate
different datasets, the large discrepancies. This casts doubt
commercially valuable fish such as orange roughy and
on the reliability of the different sources and warrants
tuna (e.g., Fonteneau, 1991; Clark, 1999). Listings of
proper quality control, regardless of where the data came
seamounts characterized by their position and summit
from, and the historical links between datasets. As a first
depth can be invaluable for fisheries management
step towards an improved database of seamount location
(Fonteneau, 1991; Rogers, 1994). By providing both
and morphometric characteristics, existing lists of sea-
commercial resources and often unique biodiversity,
mounts needed to be compiled, screened and cross-
seamounts are clearly of particular interest for conserva-
checked. We report here on the conclusions of this exercise
tion and ideal candidates for offshore and high-seas
for a number of Exclusive Economic Zones (EEZ) and
marine-protected areas (Roberts, 2002; Alder and Wood,
international waters of the western and central Pacific
2004; Schmidt and Christiansen, 2004; Davies et al.,
Ocean (WCPO). Our targeted application is tuna fisheries
2007). In this context, an accurate inventory of seamounts
management, but the exercise is useful beyond just
is necessary at both national and regional scales.
fisheries. The potential seamounts identified by Kitching-
Several studies have been recently conducted to locate
man and Lai (2004) (hereafter referred to KL04) were used
and quantify these features at the global scale (Wessel,
as the base reference. KL04 features were spatially cross-
2001; Kitchingman and Lai, 2004; Hillier and Watts, 2007).
checked with 19 different seamount and bathymetry
These broad-scale works rely on automatic (i.e., algorith-
datasets available from the literature and on the internet.
mic) detection of potential seamounts by analysis of global
Specifically, we aimed to remove features incorrectly
gravity or bathymetric data obtained by satellite and direct
classified as seamounts from KL04, to add seamounts not
ship tracks. Large-scale non-automated studies also exist
detected by these authors, to update the overall database
(Batiza, 1982; Marova, 2002). The number of seamounts
(geolocation, depth, elevation, name) and finally to compile
detected varies widely among the different datasets. A
a consistent typological framework to classify the potential
primary source of variability lies in the definition of a
seamounts into a number of geomorphological types.
seamount, its mathematical definition in the algorithm as
well as on the quality of the baseline bathymetric data.
Moreover, since ground truthing has been limited, sea-
2. Materials and methods
mount databases have largely remained unvalidated. This
situation will continue to cast doubt on the validity of
2.1. Area of interest
oceanographic studies, fisheries management decisions and
conservation strategies associated with seamounts until
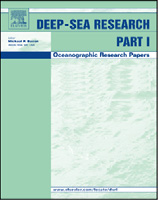
The study area located in the WCPO area was bounded
uncertainties in the different datasets have been clarified.
by the 451SŁ321N and 1301EŁ1201W domain (Fig. 1).
Fig. 1. Area of interest. It includes Exclusive Economical Zones of most Pacific Ocean countries (country codes are detailed in Table 4), and several high-
seas international areas (HS).
Author's personal copy
ARTICLE IN PRESS
V. Allain et al. / Deep-Sea Research I 55 (2008) 1035Ł1047
1037
We focused here on a number of national EEZs and
By blending GEBCO and Smith and Sandwell (1997)
international waters or high-seas areas which are relevant
bathymetry, S2004 (Dataset 1) was considered to be the
for on-going tuna fisheries and other pelagic offshore
best global bathymetric grid presently available. Other
fisheries monitoring programs.
bathymetric maps considered in this work (Datasets 2Ł5)
had much smaller spatial coverage but with higher
precision and better accuracy, having being developed
2.2. Datasets
from multibeam shipborne instruments. These maps
provided background bathymetry for this study, with the
Twenty datasets of seamount lists, bathymetric charts
highest resolution in any area used.
and maps of sub-surface and emerged features were
For shallow, emerged and partially emerged features
collected from the literature and from a variety of official
maps,
the
Millennium
Coral
Reef Mapping Project
websites. Data, sometimes with common origins, came
(MCRMP--Dataset 6) was the selected reference. MCRMP
from two main sources: satellite altimetry-derived gravity
products come from 30 m spatial resolution satellite
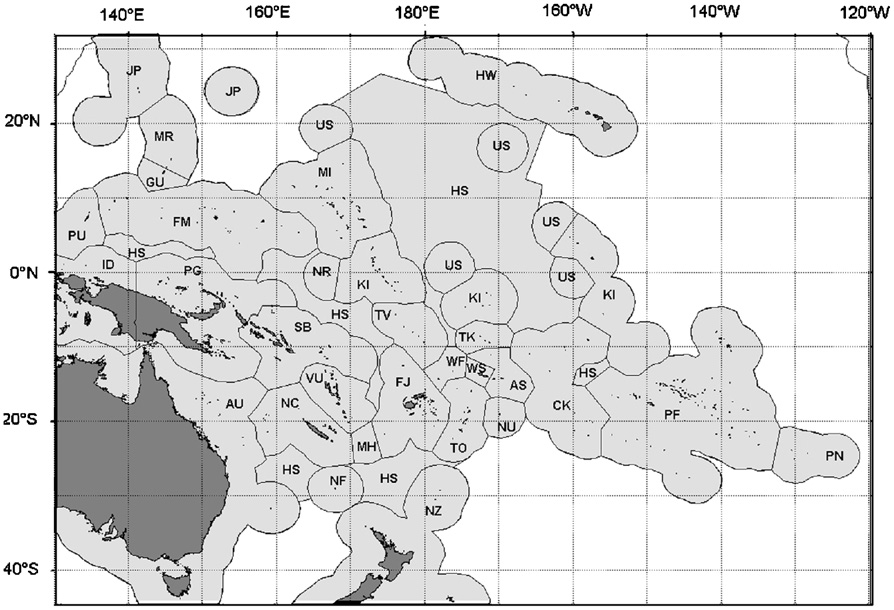
and bathymetry, and/or ship-derived bathymetry. Fig. 2
imagery captured with Landsat Enhanced Thematic Map-
summarizes the relationships among the different data-
per Plus sensor. This was complemented by the Shuttle
sets, which have variable spatial coverage and resolution
Radar
Topographic
Mission
Water
Bodies
Database
and provide different types of information with specific
(SWBD--Dataset 7) which provided land emerged areas
shortcomings and assets (Table 1). As this study was
(Table 1). MCMRP provided information on positions and
conducted from a user's point of view, no interpretation or
typology of shallow intertidal coral reef flats and patches
recalculation was carried out on the datasets; only the
along banks, atolls and islands which were not visible on
information provided as detailed in Table 1 was used.
the radar imagery used by SWBD. Large sub-surface reefs
Fig. 2. Sources of the datasets used in the cross-checking (shaded cells) and their relationships. Descriptions of datasets are detailed in Table 1.
Author's personal copy
ARTICLE IN PRESS
1038
V. Allain et al. / Deep-Sea Research I 55 (2008) 1035Ł1047
Table 1
List of the 20 datasets collected for screening and cross-checking of the seamount database in the WCPO, indicating the number of features used. Three
types of data were gathered: bathymetric maps, emerged features maps, seamount and underwater feature lists
Dataset (date of publication or data extraction)
Product description and shortcomings
Number and source
Bathymetric maps
1
S2004a,b
Worldwide bathymetry grid combining Smith and
c
Sandwell (1997) and GEBCO grids. Poor bathymetric
prediction in shallow waters, GEBCO limited by chart
accuracy
2
New Caledonia MNT bathymetryb
New Caledonia (`Mode`le Nume┤rique de Terrain')
d
bathymetry grid from single-beam and multibeam data.
Limited spatial coverage
3
Australia ETBF bathymetrya
South-East Australia bathymetry grid (`Eastern Tuna
e
and Billfish Fisheries') from US National Geophysical
Data Center 8.2 nc. Limited spatial coverage, low
resolution
4
French Polynesia bathymetrya,b
French Polynesia bathymetry grid combining satellite,
f
soundings, single-beam and multibeam data. Limited
spatial coverage
5
Tonga bathymetryb
Partial Tonga bathymetry grid from multibeam data.
g
Limited spatial coverage, partial coverage of the EEZ
Emerged and partially emerged features maps
6
MCRMP--Millennium Coral Reef Mapping
Partial worldwide delineation of coral reefs detected
h
Projecta
using Landsat satellite images. Partial coverage of the
Pacific at the time of the study due to limited Landsat
imagery availability for high seas and analysis of
Melanesia area in progress
7
SWBD-SRTM Water Body Dataa
Worldwide land delineation from Shuttle Radar
i
Topographic Mission. Shallow intertidal reefs along
land masses and sub-surface reefs without any land not
visible
Seamount/underwater features datasets
8
KL04--Kitchingman and Lai (2004)a
Worldwide list of seamount positions and summit
4626j
depth extracted automatically from ETOPO2
bathymetric chart. Flaws detailed in the study
9
NGA underwater features (Feb 2006)b
Partial worldwide list of undersea features positions,
317k
names and types from National Geospatial-Intelligence
Agency. Poor positioning, inconsistencies in feature-
type labeling
10
Seamount Catalog (Apr 2006)b
Partial worldwide list of seamounts positions, names,
438l
summit depths, elevations and types. Not standardised.
Emerged features included
11
Seamount Online (Jan 2006)b
Partial worldwide list of positions, names and types of
73m
seamounts. Not standardized. Some seamounts not
visible on bathymetric maps
12
Volcano NGDC (Feb 2006)b
Worldwide list of submarine volcanoes positions and
42n
names from US National Geophysical Data Center. Poor
positioning, some volcanoes not visible on bathymetric
maps
13
MUSORSTOM cruises (Feb 2006)b
Partial south-west Pacific list of positions, depths and
31o
names of seamounts. Depth and positions of benthic
sampling not of the summit
14
New Zealand seamounts (Apr 2006)b
New Zealand list of positions, names, depths and
456p
elevations of underwater features. Includes smaller
features than seamounts
15
Australia ETBF seamounts (May 2006)b
Partial south-east Australia list of seamount positions
24q
and names in the Australian eastern tuna and billfish
fishery
16
Wessel (2001)a
Partial worldwide list of seamount positions and
2185r
elevations extracted automatically from gravity
anomaly data derived from ERS-1 and Geosat altimetry
data. Partial coverage of the south west Pacific,
numerous features only located by this dataset, some
misidentifications observed
17
POREMA cruises (2004)b
Partial French Polynesia list of positions, names and
6s
summit depth of seamounts
18
Marshall Islands seamounts (1999)b
Partial Marshall Islands list of positions and summit
12t
depth of seamounts. Some seamounts not visible on
bathymetric maps
Author's personal copy
ARTICLE IN PRESS
V. Allain et al. / Deep-Sea Research I 55 (2008) 1035Ł1047
1039
Table 1 (continued )
Dataset (date of publication or data extraction)
Product description and shortcomings
Number and source
19
SPC tagging cruises (Apr 2006)b
Partial western and central Pacific list of positions and
30u
names of seamounts from the Secretariat of the Pacific
Community. Position of fishing not of the summit
20
GEBCO (Jul 2006)b
General Bathymetric Chart of the Oceans. Partial
335v
worldwide list of positions, summit depth, elevations,
names and types of undersea features. Not
standardised. Emerged features included, some
seamounts identified by several records, poor
positioning
a Satellite-derived data.
b Ship-derived data.
c Smith (unpublished), Marks and Smith (2006), ftp://falcon.grdl.noaa.gov/pub/walter/Gebco_SandS_blend.bi2.
d Government of New Caledonia-Zoneco programme, http://www.georep.nc/downloadspub.htm.
e Campbell and Hobday (2003).
f Bonneville and Sichoix (1998), Sichoix and Bonneville (1996).
g Wright et al. (2000), http://dusk2.geo.orst.edu/tonga/.
h Andre┤foue©t et al. (2006), http://imars.marine.usf.edu/corals/index.html.
i NASA/NGA, Version 2.0--ftp://e0srp01u.ecs.nasa.gov/.
j Kitchingman and Lai (2004), http://www.seaaroundus.org/report/seamounts/05_AKitchingman_Slai/AK_SL_TEXT.pdf.
k NGA-GEOnet Names Server (GNS), http://earth-info.nga.mil/gns/html/index.html.
l Seamount Biogeosciences Network, http://earthref.org/SBN/.
m Stocks (2005), http://seamounts.sdsc.edu/.
n Smithsonian Institution-Global Volcanism Program, http://www.volcano.si.edu/world/globallists.cfm.
o IRD (Institut de Recherche pour le De┤veloppement)--Bertrand Richer de Forges, http://www.mnhn.fr/musorstom/.
p NIWA (National Institute of Water and Atmospheric Research)--Malcolm Clarck, Rowden et al. (2005).
q Campbell and Hobday (2003).
r Wessel (2001), http://www.soest.hawaii.edu/pwessel/.
s Government of French Polynesia-ZEPOLYF programme, Ponsonnet (2004).
t SOPAC (Pacific Islands Applied Geoscience Commission)-Kojima (1999).
u SPC--OFP (Secretariat of the Pacific Community--Oceanic Fisheries Programme), Valerie Allain.
v IHO--IOC GEBCO SCUFN (International Hydrographic Organization--Intergovernmental Oceanographic Commission)--March 2006 Gazetteer,
http://www.ngdc.noaa.gov/mgg/gebco/underseafeatures.html.
without any land were not visible on SWBD data; thus,
tion for which no metadata were available; confidence in
relying only on SWBD information on land presence/
these datasets was limited. Other minor lists of seamounts
absence would be misleading. MCRMP coverage at the
or underwater features (Datasets 12, 13, 15, 17Ł19) came
time of the analysis was not exhaustive, including most of
from direct ship observation and were considered reliable.
the area of interest but excluding North Papua New Guinea,
The number of seamounts per datasets varied from 6 to 438
East Solomon Islands and Fiji. SWBD was exhaustive. Those
and the information provided differed from one dataset to
two datasets were considered highly reliable.
the other. In each dataset, information was not standardized
The two major seamount lists were obtained by
and could include seamount positions, summit depth,
automatic extraction based on the same satellite altimetry
feature type, elevation and name (Table 1).
data (Fig. 2, Table 1). The Wessel (2001) list of seamounts
Information from ship-derived datasets was consid-
(Dataset 16) was extracted from vertical gravity gradient on
ered more reliable than satellite-derived information. It is
a worldwide basis with, however, a gap in the New
also important to acknowledge the degree of interdepen-
Caledonia-Tonga area of the south-west Pacific. In the
dence between satellite-derived datasets: hence S2004,
WCPO it provided 2185 seamount positions, radius and
KL04 and Wessel (2001) were not considered independent
height. The Kitchingman and Lai (2004) (KL04--Dataset 8)
while ship-derived datasets were considered independent
list of seamounts was extracted from the ETOPO2 bathy-
(Fig. 2). The lack of metadata did not allow us to
metric map, which is based on the Smith and Sandwell
determine whether large compiled datasets such as
(1997) bathymetry computed from satellite altimetry-
Seamount Online, Seamount Catalog, NGA underwater
derived gravity (Fig. 2). In the WCPO this dataset provided
features and GEBCO were completely independent,
4626 seamount positions and summit depth.
though they were considered as such in this study.
New Zealand Seamounts (Dataset 14) was considered
the most reliable dataset for deep features, but is spatially
limited to the New Zealand area. It included seamounts
2.3. Primary reference dataset
higher than 1000 m but also numerous low-elevation
underwater features described as knolls and hills.
The Kitchingman and Lai (2004) (KL04) dataset was
GEBCO (Dataset 20), Seamount Catalog (Dataset 10),
selected for this study as the prime referential against
Seamount Online (Dataset 11) and NGA Underwater features
which the other datasets were cross-checked. KL04 is
(Dataset 9) were compilations of non-standardized informa-
a seamount list that has been developed in biodiversity
Author's personal copy
ARTICLE IN PRESS
1040
V. Allain et al. / Deep-Sea Research I 55 (2008) 1035Ł1047
and fishery contexts and is easily accessible and widely
of the datasets altogether and their presence on bathy-
used by fisheries scientists. Moreover, compared to Wessel
metric maps was verified.
(2001), the other global seamount list, KL04 provided the
Seamounts not listed in KL04 but occurring in another
highest number of features with the best spatial coverage
dataset were added to the database after screening and
in the WCPO, and also gave summit depth data. The latter
cross-checking with bathymetric maps and other datasets.
information is crucial for fisheries applications.
Since it was considered the most reliable, the first source of
addition was the New Zealand seamounts database. Other
sources of addition were, in order, Seamount Catalog,
2.4. Cross-checking method
GEBCO, Volcano NGDC data and NGA Underwater features
(Table 1). Many seamounts without information other than
All datasets of seamounts/underwater features, bathy-
position and elevation were only identified by Wessel
metric charts and sub-surface/emerged features maps
(2001). The lack of co-occurrence in other seamount
were imported into a Geographical Information System
datasets, the fact that we selected KL04 as the primary
(GIS) system prior to cross-checking. Standard GIS spatial
reference and considering the time necessary to screen the
analysis tools were used to assess the degree of overlap
large number of Wessel (2001) features against bathymetric
between the different layers.
maps, we chose not to add them to the final database.
The first step was to validate the KL04 features that
Geographically aggregated potential seamounts were
were confirmed by at least one of the other datasets
examined separately. They were plotted on top of the best-
derived from ship sounding (Fig. 2). When the feature was
resolution bathymetric map available for the area of interest
only confirmed by satellite-derived datasets (S2004 and
(i.e., multibeam maps for several EEZs or else S2004--
Wessel, 2001, i.e., non-independent datasets), the KL04
Table 1) to confirm if they represented several spatially close
feature could not be considered as `validated', but was
seamounts or a single large feature misidentified as several
noted as `cross-checked'.
seamounts. Decision criteria were based on visual inter-
Cross-checking was conducted spatially by overlaying
pretation of the bathymetric map that was trusted over the
all the available data, one EEZ after the other and then the
automatic KL04 extraction. If only one peak or one flat top
high seas. To compare between the different datasets, we
was clearly visible on the bathymetric map, the multiple
defined an 8-km buffer around each KL04 feature.
KL04 occurrences capturing this discrete large feature were
The underwater features were first compared to the
discarded. Quantitative and exactly reproducible criteria for
MCRMP and SWBD datasets (Table 1). Potential sea-
these processes would be ideal, but are non-trivial to derive
mounts misidentified for atolls and islands were flagged
and therefore beyond the scope of this paper. Redundant
according to the overlays between KL04, MCRMP and
records or duplicates were removed from the database. Only
SWBD datasets. Features were then compared to the rest
the record located at the center of the feature was retained.
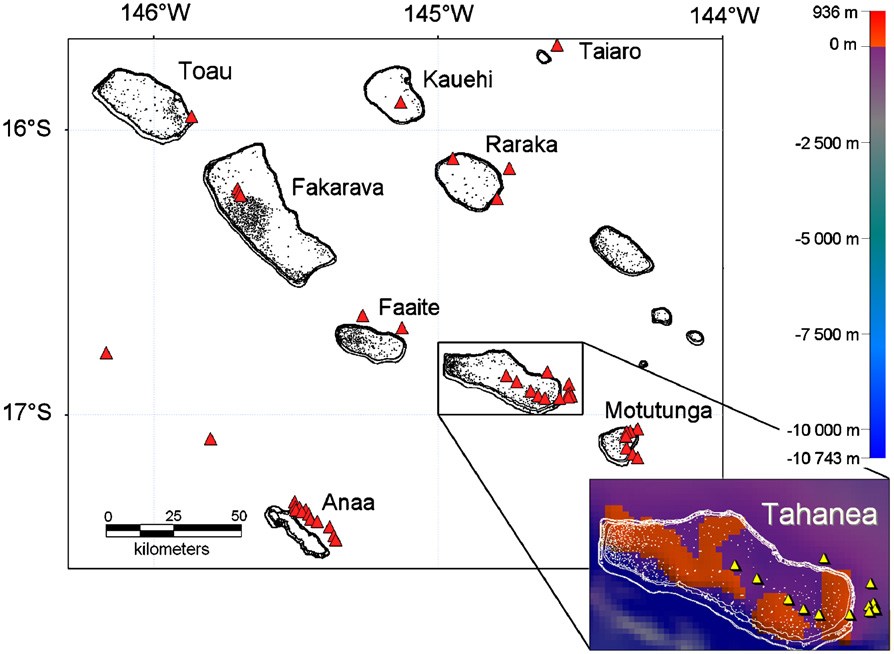
Fig. 3. Illustration of problems identified in the Kitchingman and Lai (2004) dataset. Top panel: regional view of the patterns in Tuamotu Archipelago
(French Polynesia) highlighting misidentification of KL04 seamounts (triangles) for atolls mapped by MCMRP and SWBD datasets defined in Table 1 (black
lines and dots show atoll rims and coral patches inside the atoll lagoons). This example also illustrates how large single features, here atolls, are identified
as several potential seamounts. Bottom panel: enlargement and illustration of the same issues around Tahanea Atoll in Tuamotu Archipelago with French
Polynesia bathymetry (Dataset 4) in the background.
Author's personal copy
ARTICLE IN PRESS
V. Allain et al. / Deep-Sea Research I 55 (2008) 1035Ł1047
1041
2.5. Updating the database: typology, position, summit
Elevation data were provided primarily by the New
depth, elevation and name of underwater features
Zealand Seamount dataset (Dataset 14), then by Seamount
Catalog (Dataset 10) and GEBCO (Dataset 20) and finally
The second step was to select from the different
by Wessel (2001--Dataset 16) when no other information
datasets the best attributes available for type, position,
was available.
summit depth, elevation and name.
The name of the feature was included in the database
To work consistently between datasets and to classify
when it was mentioned in one of the datasets, e.g.,
the potential seamounts, a geomorphologic typology of
Capricorn, Cross, Aotea. When different names were
underwater features was compiled. No standardized
provided by several datasets for the same feature, all
global geomorphologic typology was available despite
names were kept.
the number of definitions of underwater features (Inter-
national Hydrographic Organization and Intergovernmen-
3. Results
tal Oceanographic Commission, 2001). Compilation and
classification into the different types was made according
3.1. KL04 dataset screening
to the nomenclature used in the different datasets; it was
not based on a new examination of the geomorphology of
Overlays between datasets identified four major pro-
the feature.
blems with the KL04 dataset. These are illustrated in Fig. 3
For shallow features, we used the nomenclature from
for a Tuamotu Archipelago (French Polynesia):
the MCRMP. This provided a global standardized typology
of coral reef geomorphological types (Andre┤foue©t et al.,
2006).
(i) Type 1 error: several potential seamounts (duplicates)
For deep features, the geomorphologic typology was
were identified within one discrete large feature,
based on the nomenclature provided by the other
(ii) Type 2 error: shallow and low-relief emergent
datasets, mainly NGA underwater features (Dataset 9),
features such as atolls and islands were misidentified
Seamount Catalog (Dataset 10) and Seamount Online
as potential seamounts,
(Dataset 11) (Table 1). However, it must be acknowledged
(iii) Type 3 error: potential seamounts were incorrectly
that the different nomenclatures did not always properly
positioned,
reflect the actual shape of the labeled feature. The most
(iv) Type 4 error: summit depths were not accurate,
frequent nomenclature was retained if the same feature
especially for shallow features.
was labeled differently by several datasets (e.g., Capricorn
seamount, Capricorn guyot, Gora Kaprikorn, Capricorn
From the 14,287 potential seamounts identified globally
tablemount). In the specific case of the New Zealand
by KL04, 8952 were located in the Pacific. Specifically, in
seamount dataset (Dataset 14), underwater features were
our region of interest (Fig. 1), 4626 potential seamounts
classified into seamount, knoll and hill according to their
were identified by KL04 and screened in this study.
elevation, following the standardized terminology of the
A total of 719 potential seamounts were duplicates
International Hydrographic Organization and Intergovern-
(Type 1 error), leaving 3907 discrete features.
mental Oceanographic Commission (2001). In cases of
Of those 3907 discrete features, 373 (9.6%) were
complete lack of geomorphological terminology in any of
actually emerged or partially emerged features (island,
the datasets, the feature type was labeled as `Unknown'.
atoll, bank--Type 2 error). When considering all KL04
To update the coordinates of each KL04 potential
potential seamounts, with the duplicates, 823 (17.8%) of
seamount, we overlaid all the records from all datasets
the 4626 features are in fact low-relief emergent features.
over the best resolution bathymetry. Then, using the
Of the 3907 discrete features, 63.1% (2464) could only
bathymetry showing the real extent of the feature, we
be cross-checked with other satellite-derived datasets.
identified the record closest to the visually determined
Therefore 36.9% (1443) could be validated by an indepen-
center of the feature. The coordinates of this record were
dent ship-derived dataset.
assigned to the KL04 potential seamount. If the distance
Considering only the 3907 discrete features, the
between that record and the center of the feature on the
geographic position provided by KL04 matched approxi-
bathymetry map was more than 8 km, we assigned that
mately the center of the feature on the bathymetric map
central position.
in 73.2% of the cases. For the remaining 26.8% of features,
If available, summit depth information provided by
another source of geographic position was considered and
ship cruise datasets was retained since they were
the distance between the new position and the KL04
considered more accurate than altimetry-derived data,
positions was calculated (Type 3 error). If these distances
particularly in shallow areas. All completely submerged
were less than the known uncertainties in longitude and
features identified by MCRMP (Dataset 6) were assigned
latitude positions, they were discarded. Distances varied
an average 40 m depth value, which corresponds to the
from 1 to 47 km: 85% of the distances calculated were less
maximum depth of penetration measured by Landsat
than 10 km, 13% of the distances were between 10 and
satellite images acquired over clear oceanic waters. When
20 km and less than 2% of the distances were more than
several independent datasets provided different depth for
20 km. Examination of the data showed that values larger
the same feature, the most frequently cited value was
than 20 km were due to the identification of geomorpho-
recorded. Finally, when no other information was avail-
logic structures as large as 50Ł160 km in width such as
able, the KL04 depth data were kept unchanged.
large atoll plateaus.
Author's personal copy
ARTICLE IN PRESS
1042
V. Allain et al. / Deep-Sea Research I 55 (2008) 1035Ł1047
In the absence of any other source of information, the
Table 3
summit depth provided by KL04 was kept for 83.6% of the
Underwater feature typology with corresponding number of identified
3907 discrete features; other sources were considered for
features inventoried in the area of interest (Fig. 1)
the remaining 16.4% of the cases. When confirmed by an
Feature
Description
Number of
independent source of information other than KL04, the
type
features
difference between the depth estimates was calculated
(Type 4 error). In the case of the 373 emerged discrete
Deep
Seamount Underwater mountain rising more than 1000 m
589
features (islands, banks and atolls), KL04 provided summit
from the ocean floor and having a peaked or
depth values from 1 down to 1727 m. In 89% of the cases
flat-topped summit below the surface of the sea
the difference was less than 200 m and for 64% it was less
Hill
Elevation rising generally less than 500 m
189
than 10 m (Table 2). For the 270 underwater discrete
Knoll
Elevation rising generally more than 500 m and
155
features for which the final depth was imported from
less than 1000 m and of limited extent across
the summit
another source than KL04, in 13.3% of the cases KL04
Guyot
Flat-topped submarine mountain
74
provided a shallower value than the validated one and in
Deep
Large elevated area of the seafloor which is
29
86.7% the KL04 value was deeper. The absolute difference
Bank
relatively deep
varied between 3 and 3393 m. It was less than 1000 m for
Ridge
Long narrow elevation with steep sides
61
Plateau
Flat-topped feature of considerable extent,
2
84% of the underwater features and less than 300 m for
dropping off abruptly on one or more sides
46% (Table 2).
Shallow
Drowned Large and shallow (summit at 40 m depth max.)
47
3.2. Final database
Bank
elevation rising from the seafloor, but entirely
submerged
Compilation of the existing terminology found in the
Bank
Large and shallow elevation rising from the
42
seafloor which have an emerged or intertidal
various datasets was used to produce a 12-class geomor-
part
phologic typology based on existing published definitions
Drowned Entirely submerged and shallow elevation
33
(Table 3). According to many previous definitions, sea-
Atoll
rising from the seafloor, clearly showing a
mounts are underwater mountains rising more than
drowned rim (40 m depth max.) surrounding
1000 m above the ocean floor and have a summit below
lagoon features
Atoll
Shallow elevation rising from the seafloor
206
the surface of the sea (Rogers, 1994). In the final database,
showing an intertidal or emerged rim
589 discrete features (13.3%) were labeled as seamounts,
surrounding lagoon features
394 (8.9%) were emerged land (atolls, islands and banks),
Island
Volcanic and carbonate land mass, entirely
146
590 (13.4%) were assigned a different geomorphological
surrounded by water, with or without the
presence of shallow reefs
label (Table 3) and 2842 (64.4%) were left unlabeled due
to lack of information.
Other
To summarize, a total of 4415 discrete features have
Unknown No information is available on the feature but it 2842
is identified by an elevation on the bathymetric
been confirmed in our area of interest (3907 KL04 and 508
maps
from other databases), of which 4021 are underwater
(3534 KL04 and 487 from other databases). Of the 4021
The terms definitions were based on MCRMP for shallow features and on
discrete underwater features, 1557 (38.7%) were validated
IHO-IOC (2001)/GEBCO terminology for deep features.
by a ship-derived dataset while 2464 (61.3%) could only be
cross-checked with a satellite-derived dataset. An exam-
ple of the results of the screening and cross-checking is
attributes (i.e., reference number, KL04 reference number,
provided for Wallis and Futuna waters (Fig. 4). The
latitude, longitude, source of chosen position, summit
complete list of validated underwater features and their
depth, source of chosen depth, elevation, source of chosen
elevation, name, feature type, EEZ and cross-checking/
validation) is available as an Online Supplementary
Table 2
Quantification of KL04 Type 4-error on summit depth estimate.
Material.
Frequency distribution of the number of emerged and underwater
features per absolute difference in meters between KL04 depth estimate
and chosen depth estimate from other sources
4. Discussion
Depth difference in meters
% of emerged
% of underwater
This study has compiled a number of different datasets
(KL04 depth└chosen depth)
features (n ╝ 373) features (n ╝ 270)
into a single list of underwater features in the WCPO.
1Ł9
63.54
2.96
Duplicates and false positives have been removed, thus
10Ł99
15.28
14.44
clarifying the number of seamounts, their depth and
100Ł199
10.19
17.41
position in this region. This database is more complete
200Ł299
4.02
11.11
300Ł399
2.41
11.48
than any other available database in the region but could
400Ł499
2.14
7.04
still be augmented by the inclusion of Wessel (2001)
500Ł999
1.61
19.63
potential seamounts and Hillier and Watts (2007) under-
1000Ł1999
0.80
13.70
water features; the latter were not available at the time of
2000Ł2999
1.48
the screening process. Spatial resolution and seamount
43000
0.74
typology were the main factors introducing uncertainties
Author's personal copy
ARTICLE IN PRESS
V. Allain et al. / Deep-Sea Research I 55 (2008) 1035Ł1047
1043
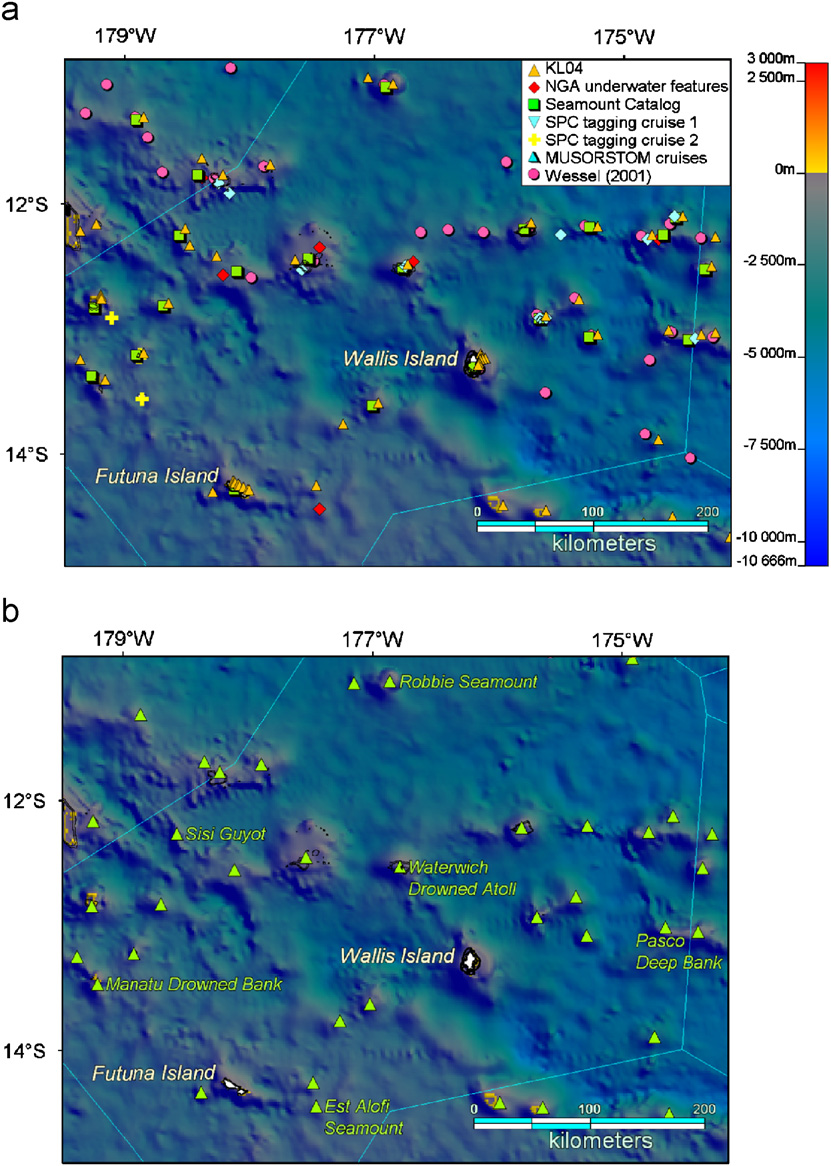
Fig. 4. Example of the seamount databases before and after cross-checking for the Wallis and Futuna area. Top panel: all datasets are presented, using
different colors and markers. Bottom panel: only the final validated underwater features are shown. Duplicates and false-positives have been removed.
Background bathymetry is S2004 (Dataset 1) with MCRMP (Dataset 6) showing sub-surface and emerged features in black lines. Light blue lines delineate
Wallis and Futuna EEZ.
in the results. These two points are discussed below
Geophysical Data Center, 2001--http://www.ngdc.noaa.
(Sections 4.1 and 4.2), followed by discussion of potential
gov/mgg/fliers/01mgg04.html). For our area of interest
applications of the new enhanced seamount dataset
ETOPO2 is itself based on the Smith and Sandwell (1997)
(Section 4.3).
2-min Mercator-projected bathymetry grid, derived from
merged satellite gravity data and ship measurements
4.1. Spatial resolution
(Fig. 2). Etnoyer (2005) considered that for bathymetry
grids based on Smith and Sandwell (1997), 50Ł90% of the
The main limitation to inferring the position, depth
depth discrepancy between actual ship data and predic-
and number of potential seamounts is the resolution
tions can be explained by large cell size, i.e., low
of the initial bathymetric grid. This was particularly
resolution. In their review of global bathymetry grids,
obvious for the KL04 dataset, which presented four types
Marks and Smith (2006) confirmed the drawbacks of
of problem: misidentification of emerged features, multi-
ETOPO2: low resolution (2 min, i.e., 13.7 km2 at the
ple detections for a discrete feature, wrong position
equator), misregistration in latitude and longitude indu-
and inaccurate summit depth. They all result from
cing a 2Ł8 km horizontal systematic offset to the north-
the ETOPO2 bathymetric grid limitations (US National
east as observed in our study, smoothing effect resulting
Author's personal copy
ARTICLE IN PRESS
1044
V. Allain et al. / Deep-Sea Research I 55 (2008) 1035Ł1047
in blurred features, especially for seamount summits, and
4.2. Typology
poor bathymetry prediction in shallow waters. Watts et al.
(2006) confirmed that satellite-altimetry bathymetric
The second major limitation to the proper identifica-
predictions were highly variable at the ca. 10 km scale.
tion of underwater features as seamounts is the absence
These facts alone explain most of the errors we noticed in
of standardized terminology to geomorphologically label
the cross-checking exercise.
and name undersea features. Here, we compiled a 12-class
The absolute difference in summit depth between
geomorphological typology to clearly separate seamounts
KL04 values and final validated values varied between 3
from other undersea features. For shallow features (large
and 3393 m. However, differences were less than 100 m
coral reefs, atolls and drowned atolls), the classification
for 79% of the emerged features, and less than 1000 m for
provided by MCRMP (Dataset 6) was standardized based
84% of the underwater features. Absolute errors on
on the geomorphological zonations detectable consis-
summit depth (or on seamount height) were previously
tently worldwide with Landsat images. However, for deep
quantified by comparing satellite-derived bathymetry
features, it appeared that the labels extracted from the
with seabeam acoustic data. For instance, errors as high
different datasets and charts did not always properly
as 725% of the actual value were reported by Wessel and
reflect the actual geomorphology as seen on bathymetric
Lyons (1997) and errors in the order of 713% to 15% were
maps, despite the existing terminology of underwater
calculated by Baudry (1991). In their study on bathymetric
features (International Hydrographic Organization and
prediction from satellite altimetry, Smith and Sandwell
Intergovernmental Oceanographic Commission, 2001).
(1994) concluded that peak amplitudes are not well
We noticed that 64% of screened features lacked any
resolved. Consequently, summit depths are often not
geomorphologic label at all and were not described.
reliable. Evaluating the fit between their predictions and
Moreover, the majority of underwater features (61.3%)
soundings, they concluded that errors were less than 96 m
were only identified by satellite-derived datasets; 29.1%
for 50% of the seamounts. More than 80% of the
were identified by 2 independent datasets and only 9.6%
differences were lower than 257 m. Smith and Sandwell
were identified by 3Ł8 independent different datasets.
(2004) also showed that the accuracy of seamount
Thus, few seamounts were really well described by
detection from altimetry data decreased when water
different sources of information, and very few seamounts
depth increased.
have been thoroughly explored in situ. It is estimated that
A further problem is that the spatial resolution of
from the 100,000 potential seamounts worldwide, less
computed global bathymetry grids based on altimetry
than 200 have been investigated in detail (Gjerde, 2006).
data only allows detection of large seamounts. In their
Good-quality topography information is essential for a
study, Kitchingman and Lai (2004) used a 1000 m-height
proper geomorphologic description and labeling. The
criterion to define and detect seamounts. Wessel and
development of a worldwide project equivalent to Millen-
Lyons (1997) had a 1500 m resolution limit. These authors
ium Coral Reef Mapping Project for shallow coral reefs
respectively detected 4626 and 4278 features in our
(Andre┤foue©t et al., 2006) would provide a proper,
area of interest (Fig. 1). On the other hand, a recent
exhaustive and consistent classification of undersea
analysis available to us after the completion of this
features worldwide. Such a study would require the
present work (Hillier and Watts, 2007) used high-resolu-
acquisition of detailed bathymetric maps to distinguish
tion ship-track bathymetry to detect features with eleva-
the geomorphology of the features, and a validation
tions from the seafloor between 100 and 6700 m. They
process with standardized criteria to consistently label
reported many more smaller underwater features such
the different structures observed. Another line of research
as hills and knolls and identified 28,369 features in our
would be to refine the algorithms detecting and describ-
area of interest, i.e., one order of magnitude more
ing seamounts in order to automatically account for the
than previous counts. However, when considering only
diversity of seamount morphology (Wessel and Lyons,
features higher than 1000 m, the number of seamounts
1997; Kitchingman and Lai, 2004).
detected was approximately the same (3525), scattered
only along ship tracks and thus without exhaustive spatial
coverage. This later study demonstrates clearly that fine-
4.3. Application of the new seamount list for fisheries
resolution data are required to accurately detect all
management and conservation
features.
Marks and Smith (2006) and Sandwell et al. (2006)
There are many potential applications for an accurate
recently argued in favor of a new bathymetry from space
list of seamounts providing exact positions and summit
mission to obtain higher-resolution data. Such data would
depths. Two applications of particular interest for the
avoid most of the island and atoll misidentifications from
countries, territories and regional organizations of the
the beginning of the process, and would not have to cross-
WCPO are the study of the influence of seamounts on
check a posteriori as we have done here. It would also
pelagic fisheries and the identification of specific sea-
allow detection of small and narrow seamounts (pinna-
mounts for biodiversity conservation.
cles) that at the moment fall below the resolution of
The exploration of the relationships between sea-
existing data (Smith and Sandwell, 1997). Sandwell et al.
mounts and fisheries at the regional level is a key
(2006) estimated that an improvement in altimeter height
application. Seamounts and other elevations are known
resolution by a factor of 2 should increase by 18-fold the
to aggregate benthic, bentho-pelagic and pelagic fish, a
total number of seamounts mapped.
characteristic used by the fishers to find commercial
Author's personal copy
ARTICLE IN PRESS
V. Allain et al. / Deep-Sea Research I 55 (2008) 1035Ł1047
1045
resources in vast open ocean areas. Benthic and bentho-
small as a 12 m elevation, can have an impact on the
pelagic fisheries (such as for orange roughy) have been the
surrounding ecosystem. The summit depth is as important
focus of some studies because of the impact on benthic
as the elevation itself. Seamounts of interest for pelagic
habitats by bottom trawling (Koslow et al., 2000; Hall-
fisheries are probably those with summits, in the euphotic
Spencer et al., 2002; Clark and O'Driscoll, 2003; Gianni,
zone, or in intermediate position (summit does not reach
2004). Less destructive practices (e.g., bottom longline
the euphotic zone but is above the lower limit of the DSL).
and handline) are also used to catch commercial species
In the WCPO, tuna fisheries caught an estimated 2.2
such as deep-sea snappers or alfonsino (Seki and Tagami,
million tonnes of tuna in 2006, representing 51% of the
1986; Kirkwood, 1999). Pelagic fisheries have also devel-
global tuna catch for an economic value of US$2964
oped around seamounts and other underwater features
million (Williams and Reid, 2007). Pelagic fisheries
but are less well documented (Fonteneau, 1991). These
around some seamounts in Australia, Hawaii and Tonga
fisheries target tuna, billfish and other large pelagic fish
have been documented and are well known by fishers
caught with purse seine, pelagic longline and by the sport
(Yasui, 1986; Itano and Holland, 2000; Campbell and
fishery (Muhlia Melo et al., 2003). Several hypotheses
Hobday, 2003; Beverly et al., 2004). However, despite the
exist to explain the aggregation of pelagic fish around
existence of large pelagic fisheries datasets covering the
seamounts. They are mainly related to the presence of
whole WCPO (Secretariat of the Pacific Community
enhanced feeding sources, e.g., enhanced productivity
repository), the previous gaps in accurate seamount data
created by the particular oceanographic conditions and
have prevented quantification of the relationship between
the trapping of the so-called deep-scattering layer (DSL) of
seamounts and pelagic fisheries production at the regional
micronektonic fish, molluscs and crustaceans. The work of
scale. Positions and depths of seamounts and other
Bett (2001) indicates that any elevated feature, even as
underwater features of interest for fisheries can now be
more confidently cross-checked with tuna fisheries data
in the region to assess the importance of seamounts for
tuna production and fisheries dynamics.
Table 4
Seamounts are vulnerable ecosystems (Gianni, 2004).
Number of confirmed underwater features in the high seas and in EEZs of
the Western and Central Pacific Ocean as shown in Fig. 1
While monitoring and restriction of anthropogenic im-
pacts such as mining and fisheries activities are valuable
Area
EEZ 2-digit
Number of underwater
management options, the implementation of marine
code
features
protected areas (MPAs) encompassing seamounts is
High seas
HS
654
believed to be the most efficient option for their
conservation (Johnston and Santillo, 2004; Schmidt and
EEZs
Christiansen,
2004).
Moreover,
several
international
East Australia
AU
50
bodies have called for the implementation of offshore
East Indonesia
ID
26
and high seas MPAs for biodiversity protection and
Hawaii
HW
219
conservation, and seamounts have been identified as good
North New Zealand
NZ
420
South Japan and territories JP
259
candidates (Convention on Biological Diversity, 2003;
USA Territories
US
207
Scovazzi, 2004; Davies et al., 2007).
The worldwide level of seamount protection was
PICT EEZs
summarized by Alder and Wood (2004). They calculated
American Samoa
AS
34
that approximately 346 seamounts were included in 84
Cook Islands
CK
108
MPAs in various EEZs. In the Pacific Ocean, more than 17
Fiji
FJ
112
seamounts in the Huon Commonwealth Marine Reserve in
Federated States of
FM
236
Micronesia
Tasmania, Australia have been protected since 28 June 2007
French Polynesia
PF
341
(http://www.environment.gov.au/coasts/mpa/southeast/
Guam
GU
45
huon/index.html). Approximately 66 seamounts in the
Kiribati
KI
255
Papaha»naumokua»kea Marine National Monument in
Marshall Islands
MI
153
Matthew and Hunter
MH
23
Hawaii, USA (formerly the Northwestern Hawaiian
Northern Mariana
MR
147
Islands Marine National Monument) and the Bowie
Nauru
NR
6
seamount in British Columbia, Canada (Canessa et al.,
New Caledonia
NC
57
2003) are included in MPAs. In other countries, manage-
Niue
NU
14
ment options such as closure to trawling and dredging
Norfolk Island
NF
26
Palau
PU
110
have been implemented; e.g., in New Zealand 19
Pitcairn
PN
34
seamounts have been closed since May 2001, and new
Papua New Guinea
PG
91
regulations have been in force since November 2007
Samoa
WS
15
(http://www.fish.govt.nz/en-nz/Environmental/Seabed+
Solomon Islands
SB
157
Tokelau
TK
32
Protection+and+Research/Benthic+Protection+Areas.htm).
Tonga
TO
73
In New Caledonia, at least 9 seamounts have been closed
Tuvalu
TV
60
since April 2004 (ftp://ftp.juridoc.gouv.nc/jonc/7777.pdf).
Vanuatu
VU
27
On a regional scale, however, seamounts, like most
Wallis and Futuna
WF
30
shallow marine habitats, remain poorly protected (Alder
PICT: Pacific Island Countries and Territories.
and Wood, 2004; Mora et al., 2006).
Author's personal copy
ARTICLE IN PRESS
1046
V. Allain et al. / Deep-Sea Research I 55 (2008) 1035Ł1047
By providing an updated list of seamounts, this study
Appendix A. Supplementary materials
will help Pacific Island Countries and Territories (PICTs)
and Regional Fisheries Management Organizations such as
Supplementary data associated with this article
the Western and Central Pacific Fisheries Commission
can be found in the online version at doi:10.1016/j.dsr.
(WCPFC) or the South Pacific Regional Fisheries Manage-
2008.04.004.
ment Organization (SPRFMO) to identify seamounts for
protection and management in national waters and in the
high seas of the WCPO. According to our study, 3369
underwater features are located in EEZs, i.e., under
References
national jurisdiction (Fig. 1). Of these, 2187 are in the
EEZs of the PICTs (Table 4). A total of 654 potential
Alder, J., Wood, L., 2004. Managing and protecting seamounts ecosys-
tems. Fisheries Centre Research Reports 12 (5), 67Ł73.
seamounts have been validated in the adjacent high
Andre┤foue©t, S., Muller-Karger, F.E., Robinson, J.A., Kranenburg, C.J., Torres-
seas (Fig. 1). These seamounts are thus located beyond
Pulliza, D., Spraggins, S.A., Murch, B., 2006. Global assessment of
national jurisdiction and their management will require
modern coral reef extent and diversity for regional science and
management applications: a view from space. In: Proceedings of the
the cooperation of the different existing legal instruments
10th International Coral Reef Symposium, pp. 1732Ł1745.
at the global and regional levels and possibly the
Batiza, R., 1982. Abundances, distribution and sizes of volcanoes in the
development of new legal mechanisms and tools (Kimball,
Pacific Ocean and implications for the origin of non-hotspot
2005).
volcanoes. Earth and Planetary Science Letters 60 (2), 195Ł206.
Baudry, N., 1991. 3-D modelling of seamount topography from satellite
altimetry. Geophysical Research Letters 18 (6), 1143Ł1146.
Bett, B.J., 2001. UK Atlantic Margin Environmental Survey: introduction
and overview of bathyal benthic ecology. Continental Shelf Research
5. Conclusion
21 (8Ł10), 917Ł956.
Beverly, S., Robinson, E., Itano, D., 2004. Trial setting of deep longline
Cross-checking of available seamount and bathymetry
techniques to reduce bycatch and increase targeting of deep-
swimming tunas. In: 17th Meeting of the Standing Committee on
datasets provided a much needed enhanced list of
Tuna and Billfish, SCTB17, Majuro, Marshall Islands, 9Ł18 August
seamounts
and
other
underwater
features
in
the
2004, FTWG-7a, pp. 1Ł28.
WCPO. The study emphasized that only large seamounts
Bonneville, A., Sichoix, L., 1998. Topographie des fonds oce┤aniques de la
Polyne┤sie franc-aise: synthe`se et analyse. Ge┤ologie de la France 3,
could be detected with existing altimetry data. When
15Ł28.
they were correctly identified, their characteristics
Campbell, R., Hobday, A.J., 2003. SwordfishŁEnvironmentŁSeamountŁ
(geomorphology, position and summit depth) often
Fishery interactions off eastern Australia. Report of the Australian
remained poorly estimated. This exercise highlights the
Fisheries Management Authority, 597.780994, pp. 1Ł97.
Canessa, R.R., Conley, K.W., Smiley, B.D., 2003. Bowie seamount pilot
need for higher-resolution bathymetry and to further
marine protected area: an ecosystem overview report. Canadian
conduct a worldwide review and geomorphological
Technical Report of Fisheries and Aquatic Sciences 2461, 1Ł85.
classification of underwater features. These improve-
Clark, M.R., 1999. Fisheries for orange roughy (Hoplostethus atlanticus) on
seamounts in New Zealand. Oceanologica Acta 22 (6), 593Ł602.
ments would greatly enhance existing databases, espe-
Clark, M.R., O'Driscoll, R., 2003. Deepwater fisheries and aspects of their
cially by accurately incorporating all the small and narrow
impact on seamount habitat in New Zealand. Journal of Northwest
underwater features currently undetectable. Nevertheless,
Atlantic Fishery Science 31, 441Ł458.
Convention on Biological Diversity, 2003. Management of risks to the
we hope and expect that the list of seamounts and
biodiversity of seamounts and cold-water corals communities
underwater features produced by this study will quickly
beyond national jurisdiction UNEP/CBD/COP/7/INF/25, pp. 1Ł11.
be used for numerous applications in biodiversity con-
Davies, A.J., Roberts, J.M., Hall-Spencer, J., 2007. Preserving deep-sea
natural heritage: emerging issues in offshore conservation and
servation and fisheries management. The updated list
management. Biological Conservation 138 (3Ł4), 299Ł312.
(see Online Supplementary Material) is still imperfect
Etnoyer, P., 2005. Seamount resolution in satellite-derived bathymetry.
but it provides a substantial enhancement of previous
G3 Geochemistry Geophysics Geosystems an Electronic Journal of
the Earth Sciences 6 (3), 1Ł8.
databases.
Fonteneau, A., 1991. Monts sous-marins et thons dans l'Atlantique
tropical est. Aquatic Living Resources 4, 13Ł25.
Gianni, M., 2004. High Seas Bottom Trawl Fisheries and Their Impacts on
the Biodiversity of Vulnerable Deep-sea Ecosystems: Options for
Acknowledgments
International Action. IUCN, Gland, Switzerland, 88pp.
Gjerde, K.M., 2006. Ecosystems and biodiversity in deep waters and high
seas. UNEP Regional Seas Report and Studies 178, 1Ł60.
This study was funded by the UNDP GEF Pacific Islands
Hall-Spencer, J., Allain, V., Fossa░, J.H., 2002. Trawling damage to
Northeast Atlantic ancient coral reefs. Proceedings of the Royal
Oceanic Fisheries Management Project. The Millennium
Society of London B 269, 507Ł511.
Coral Reef Mapping Project was funded by NASA Grants
Hillier, J.K., Watts, A.B., 2007. Global distribution of seamounts from
NAG5-10908 to S.A. and F.M.K. and Grant CARBON-0000-
ship-track bathymetry data. Geophysical Research Letters 34
0257 to Julie Robinson (NASA). The NASA/Interdisciplinary
(L13304).
International Hydrographic Organization, Intergovernmental Oceano-
Program Grant NNG04GO90G to S.A. and F.M.K. provided
graphic Commission, 2001. Standardization of Undersea Feature
additional support for this study. New Zealand seamounts
Names. Guidelines Proposal Form Terminology. Bathymetric Pub-
data was provided by the NIWA Seamount Fisheries
lication No. 6. International Hydrographic Bureau, Monaco, 40pp.
Itano, D., Holland, K.N., 2000. Movement and vulnerability of bigeye
Project (FRST contract CO1 ┬ 0508). Christine Kranenburg
(Thunnus obesus) and yellowfin (Thunnus albacares) in relation to
and Alan Spraggins at USF significantly helped with atoll
FADs and natural aggregation points. Aquatic Living Resources 13,
mapping and GIS data handling. We would like to thank
213Ł223.
Johnston, P.A., Santillo, D., 2004. Conservation of seamount ecosystems:
the anonymous reviewers who offered valuable criticisms
application of a marine protected areas concept. Archive of Fishery
of the manuscript.
and Marine Research 51 (1Ł3), 305Ł319.
Author's personal copy
ARTICLE IN PRESS
V. Allain et al. / Deep-Sea Research I 55 (2008) 1035Ł1047
1047
Kimball, L.A., 2005. The international legal regime of the high seas
Schmidt, S., Christiansen, S., 2004. The Offshore MPA Toolbox: Imple-
and the seabed beyond the limits of national jurisdiction and options
menting Marine Protected Areas in the North-east Atlantic Offshore:
for cooperation for the establishment of marine protected areas
Seamounts--A Case Study. OASIS and WWF Germany, Hamburg,
(MPAs) in marine areas beyond the limits of national jurisdiction.
Frankfurt am Main, 56pp.
Secretariat of the Convention on Biological Diversity Technical Series
Scovazzi, T., 2004. Marine protected areas on the high seas: some legal
19, 1Ł64.
and policy considerations. The International Journal of Marine and
Kirkwood, G.P., 1999. Management Strategies for New or Lightly
Coastal Law 19 (1), 1Ł17.
Exploited Fisheries Final Technical Report. MRAG Ltd, London, 45pp.
Seki, M.P., Tagami, D.T., 1986. Review and present status of handline
Kitchingman, A., Lai, S., 2004. Inferences on potential seamount locations
fisheries for alfonsino. NOAA Technical Report NMFS 43, 31Ł35.
from mid-resolution bathymetric data. Fisheries Centre Research
Sichoix, L., Bonneville, A., 1996. Prediction of bathymetry in French
Reports 12 (5), 7Ł12.
Polynesia constrained by shipboard data. Geophysical Research
Kojima, K., 1999. Report on the cobalt-rich manganese crust resources in
Letters 23, 2469Ł2472.
the waters of the Republic of the Marshall Islands: Based on the
Smith, D.K., Jordan, T.H., 1988. Seamount statistics in the Pacific Ocean.
results of the cooperation study project on the deepsea mineral
Journal of Geophysical Research 93 (B4), 2899Ł2918.
resources in selected offshore areas of the SOPAC Region. SOPAC
Smith, W.H.F., Sandwell, D.T., 1994. Bathymetry prediction from dense
Technical Report 293, 1Ł9.
satellite altimetry and sparse shipboard bathymetry. Journal of
Koslow, J., Boehlert, G.W., Gordon, J.D.M., Haedrich, R.L., Lorance, P., Parin,
Geophysical Research 99 (B11), 21803Ł21824.
N., 2000. Continental slope and deep-sea fisheries: implications for a
Smith, W.H.F., Sandwell, D.T., 1997. Global sea floor topography from
fragile ecosystem. ICES Journal of Marine Science 87, 548Ł557.
satellite altimetry and ship depth soundings. Science 277 (5334),
Marks, K.M., Smith, W.H.F., 2006. An evaluation of publicly available
1956Ł1962.
global bathymetry grid. Marine Geophysical Researches 27 (1),
Smith, W.H.F., Sandwell, D.T., 2004. Conventional bathymetry, bathyme-
19Ł34.
try from space, and geodetic altimetry. Oceanography 17 (1), 8Ł23.
Marova, N.A., 2002. Seamounts of the World Ocean: features of their
Stocks, K., 2005. Seamounts Online: An Online Information System for
distribution by height and space. Oceanology 42 (3), 409Ł413.
Seamount Biology Version 2005-1. World Wide Web Electronic
Mofjeld, H.O., Titov, V.V., Gonza┤lez, F.I., Newman, J.C., 2001. Tsunami
Publication /http://seamounts.sdsc.eduS.
scattering provinces in the Pacific Ocean. Geophysical Research
Watts, A.B., Sandwell, D.T., Smith, W.H.F., Wessel, P., 2006. Global gravity,
Letters 28 (2), 335Ł337.
bathymetry, and the distribution of submarine volcanism through
Mora, C., Andre┤foue©t, S., Costello, M., Kranenburg, C., Rollo, A., Veron, J.,
space and time. Journal of Geophysical Research 111 (B08408), 1Ł26.
Gaston, K., Myers, R., 2006. Coral reefs and the global network of
Wessel, P., 2001. Global distribution of seamounts inferred from gridded
marine protected areas. Science 312, 1750Ł1751.
Geosat/ERS-1 altimetry. Journal of Geophysical Research 106 (B9),
Muhlia Melo, A., Klimley, P., Gonza┤lez Armas, R., Trasvin
~ a Castro, A.,
19431Ł19441.
Rodri┤guez Romero, J., Amador Buenrostro, A., 2003. Pelagic fish
Wessel, P., Lyons, S., 1997. Distribution of large Pacific seamounts from
assemblages at the Espi┤ritu Santo seamount in the Gulf of California
Geosat/ERS-1: implications for the history of intraplate volcanism.
during El Nin
~ o 1997Ł1998 and non-El Nin~o conditions. Geofi┤sica
Journal of Geophysical Research 102 (B10), 22459Ł22475.
Internacional 42 (3), 473Ł481.
White, M., Bashmachchnikov, I., Ari┤stegui, J., Martins, A., 2007. Physical
Ponsonnet, C., 2004. Les paru. Bilan des connaissances acquises et
processes and seamount productivity. In: Pitcher, T.J., Morato, T.,
perspectives d'exploitation en Polyne┤sie Franc-aise. Document et
Hart, P.J.B., Clark, M.R., Haggan, N., Santos, R.S. (Eds.), Seamounts:
travaux du programme ZEPOLYF 3, 1Ł214.
Ecology, Fisheries & Conservation. Blackwell Publishing Ltd., Oxford,
Richer de Forges, B., Koslow, J.A., Poore, G.B.C., 2000. Diversity and
pp. 65Ł84.
endemism of the benthic seamount fauna in the southwest Pacific.
Williams, P.G., Reid, C., 2007. Overview of tuna fisheries in the Western
Nature 405, 944Ł947.
and Central Pacific Ocean, including economic conditions--2006. In:
Roberts, C.M., 2002. Deep impact: the rising toll of fishing in the deep
3rd Regular Session of the Scientific Committee of the Western and
sea. Trends in Ecology and Evolution 17 (5), 242Ł245.
Central Pacific Fisheries Commission, WCPFC-SC3, Honolulu, Hawaii,
Rogers, A.D., 1994. The biology of seamounts. Advances in Marine Biology
USA, 13Ł24 August 2007, GN WP-1, pp. 1Ł43.
13, 305Ł350.
Worm, B., Lotze, H.K., Myers, R.A., 2003. Predator diversity hotspots in
Rowden, A.A., Clark, M.R., Wright, I.C., 2005. Physical characterisation
the blue ocean. Proceedings of the National Academy of Sciences 100
and a biologically focused classification of ``seamounts'' in the New
(17), 9884Ł9888.
Zealand region. New Zealand Journal of Marine and Freshwater
Wright, D.J., Bloomer, S.H., MacLeod, C.J., Taylor, B., Goodlife, A.M., 2000.
Research 39, 1039Ł1059.
Bathymetry of the Tonga Trench and Forearc: a map series. Marine
Sandwell, D.T., Smith, W.H.F., Gille, S., Kappel, E., Jayne, S., Khalid, S.,
Geophysical Researches 21, 489Ł511.
Coakley, B., Ge┤li, L., 2006. Bathymetry from space: rationale and
Yasui, M., 1986. Albacore, Thunnus alalunga, pole-and-line fishery
requirements for a new, high-resolution altimetric mission. Comp-
around the Emperor Seamounts. NOAA Technical Report NMFS 43,
tes-Rendus de Geoscience 338 (14Ł15), 1049Ł1062.
37Ł40.